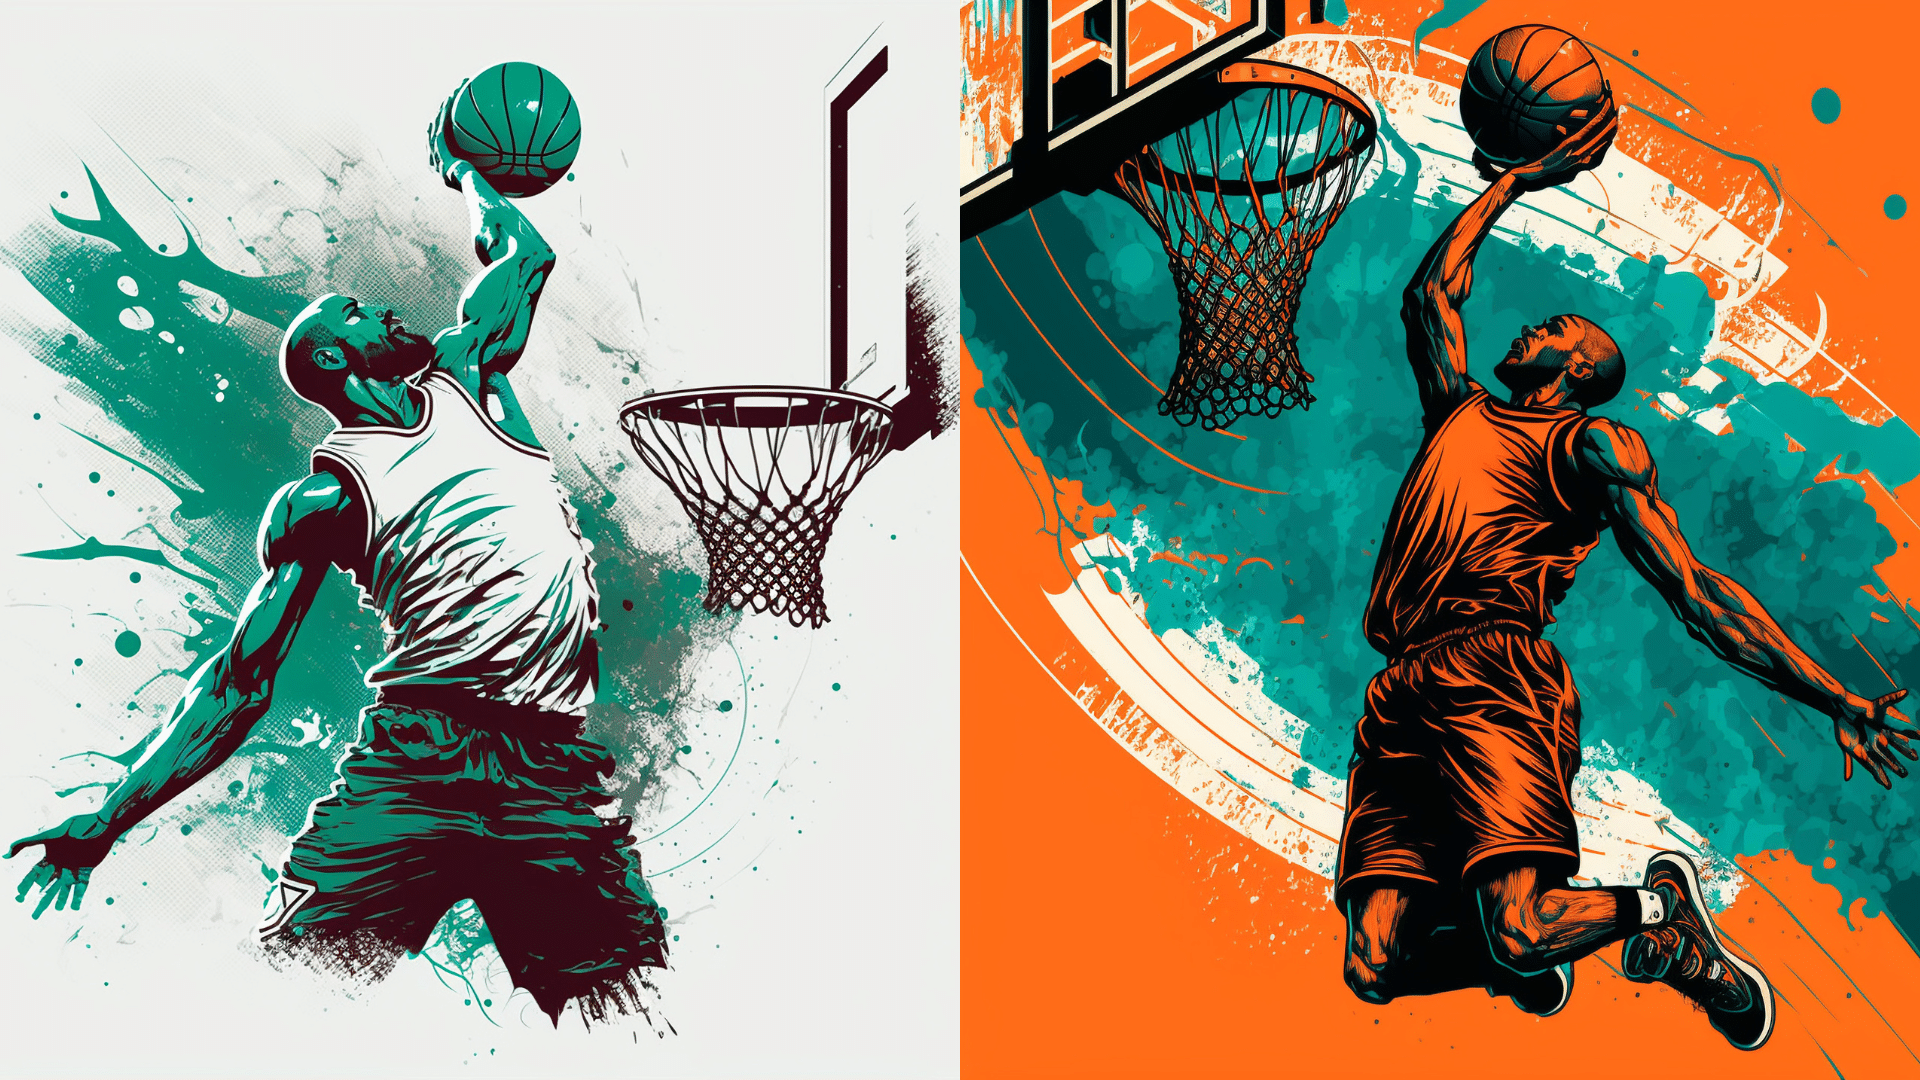
How to Create Infographics that Are Cooler than Michael Jordan
He was totally a boss on the court! I will never dispute that. However, how #23 wields his graphic design game may not be on par with his ability to dunk, dribble, and get it in the net – each time, every time.
For those of us who want to up our content creation skills and incorporate infographics into what we produce – there are some awesome resources out there to help. You don’t need to be a seasoned graphic designer to put together a visual display of information, facts, or whatever it is you want to showcase that also looks oh-so cool at the same time.
Here's 3 online tools that you can help look like a pro and create infographics that are cooler than MJ:
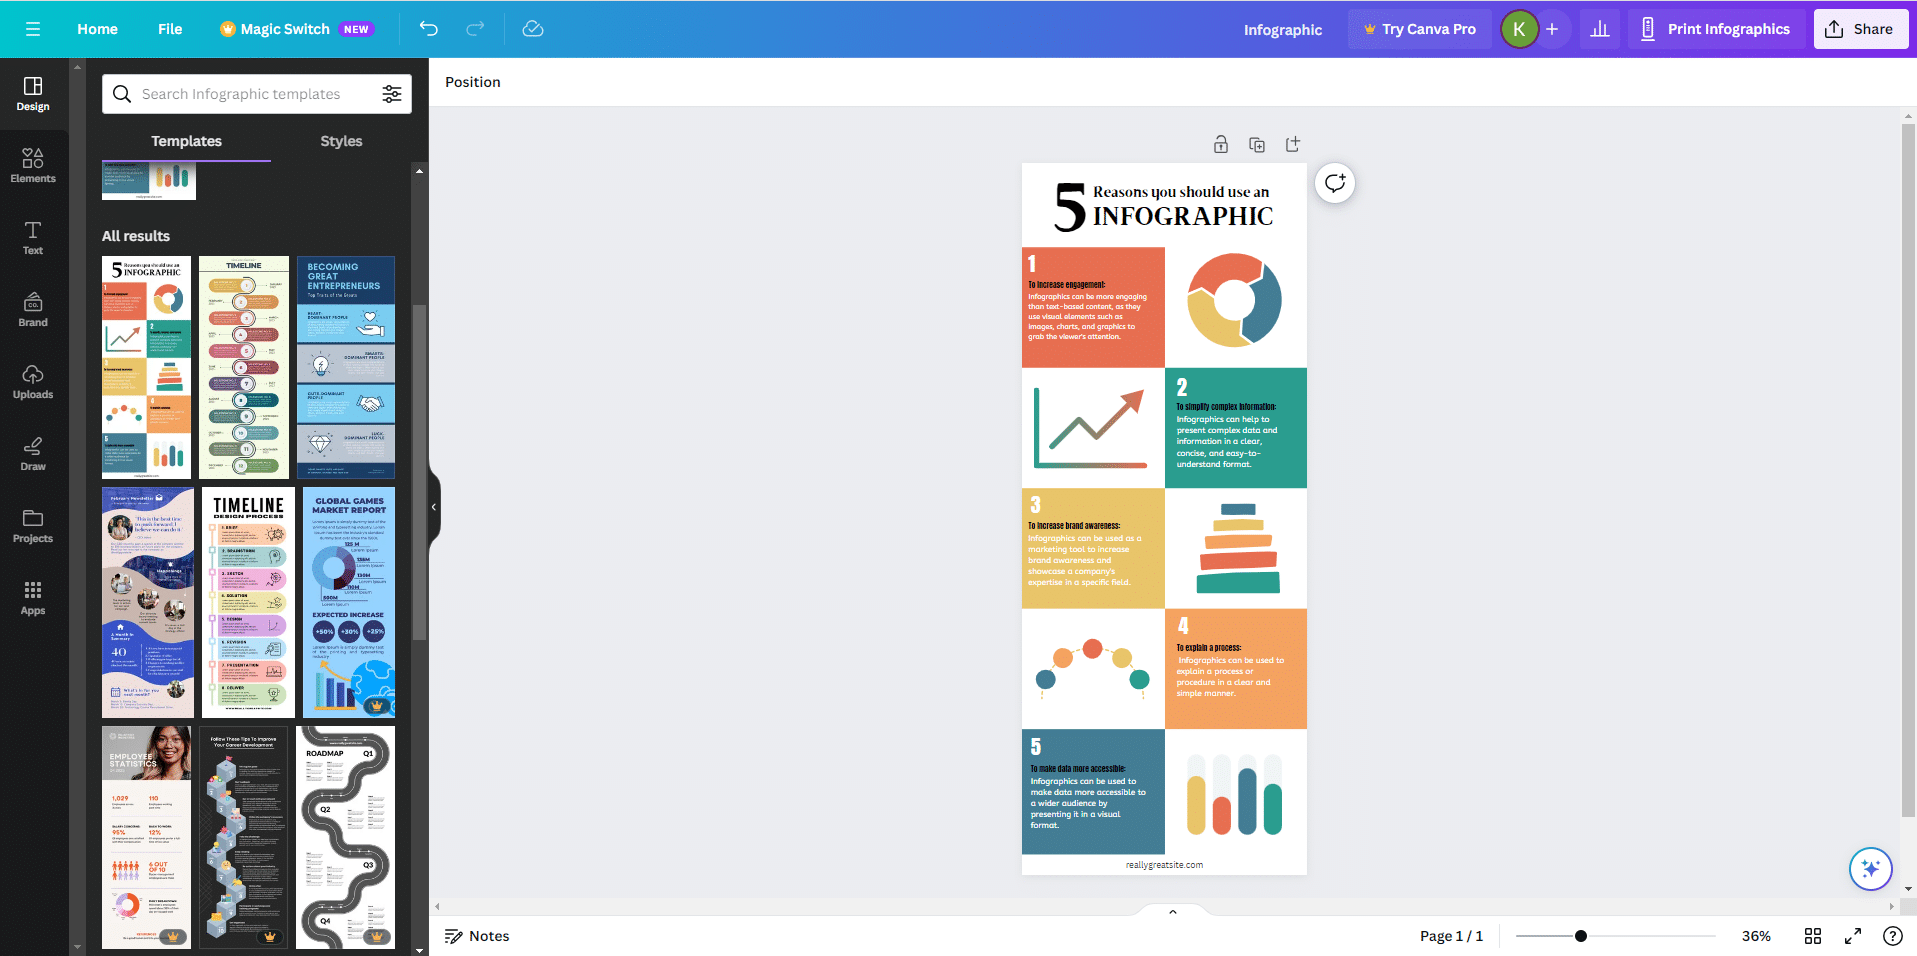
Canva is a free, intuitive platform that houses hundreds of fonts and tons of images that you can easily incorporate into an infographic. For a buck, you can buy premium images and you’re able to edit the images within the program. In addition to infographics, Canva allows you to design a whole suite of visual content – pinterest graphics, facebook posts, presentations, letterheads, business cards, the list goes on.
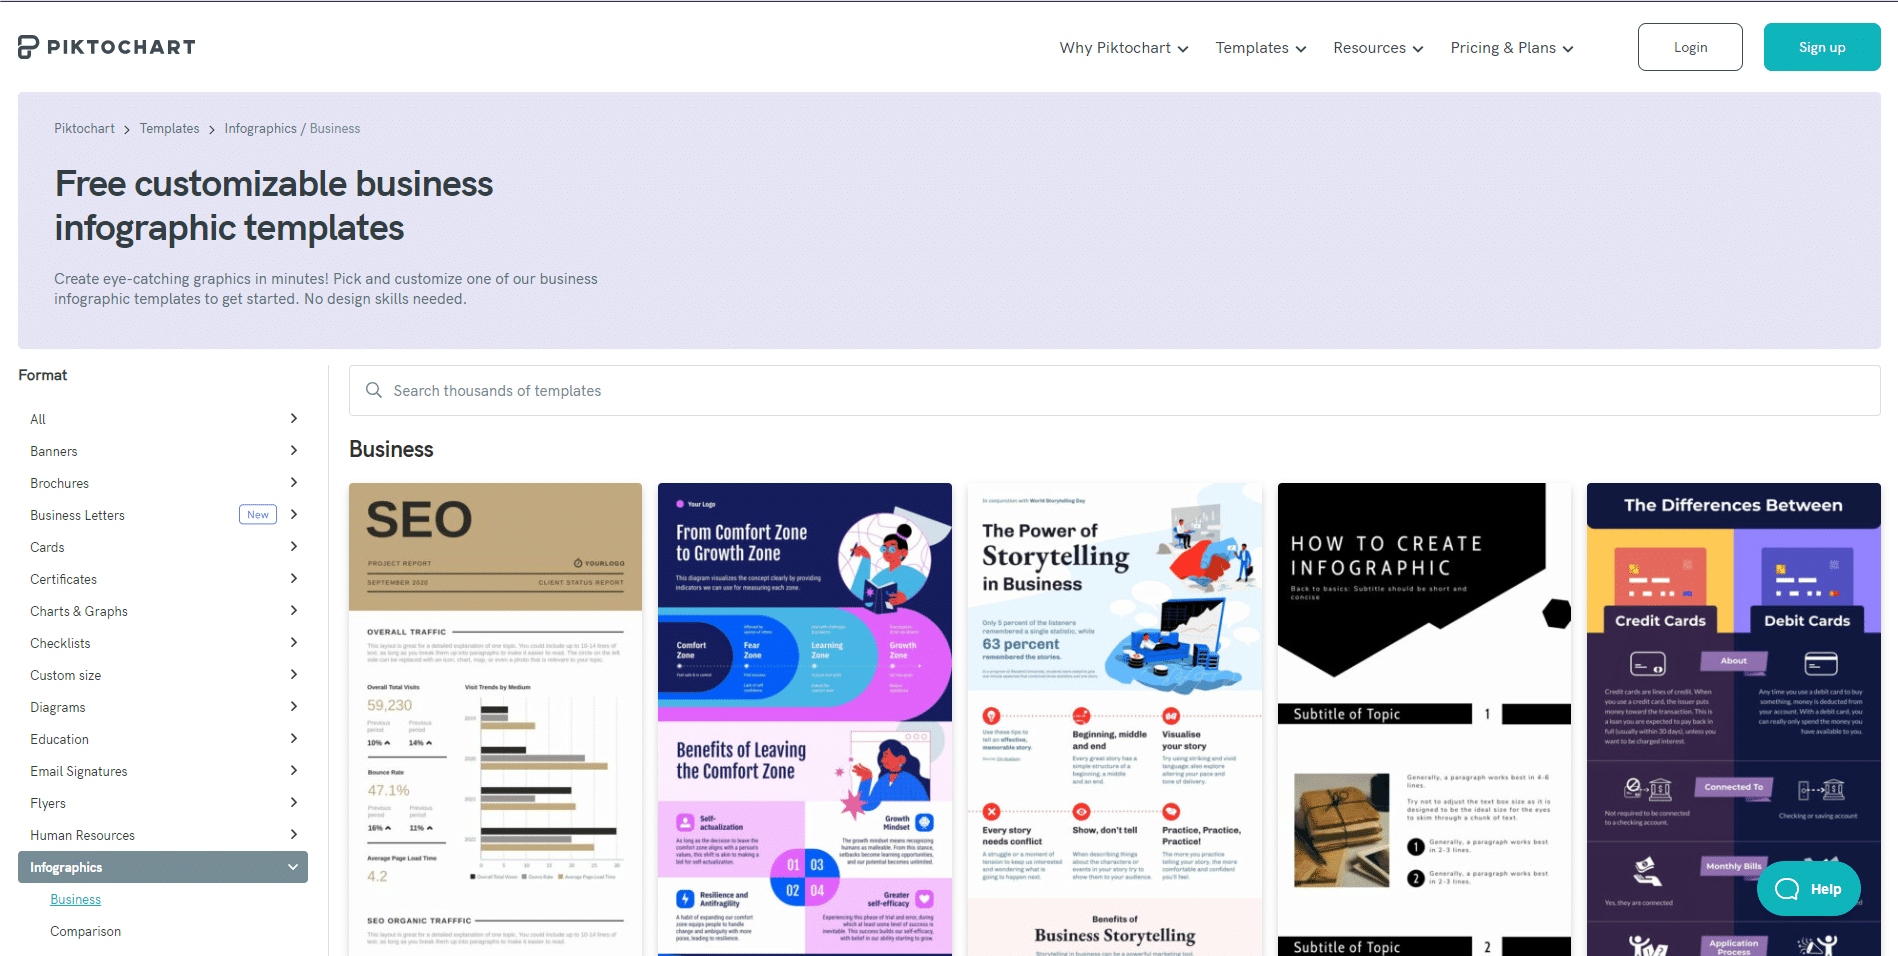
Piktochart has over 400 fully customizable themes to create awesome infographics. Fine, with the free account you don’t have access to all the features Piktochart provides but even still. With more than 1,000 images and 4,000 plus icons to choose from and the ability to share your completed infographics once they’re done, Piktochart is a great resource for non-designers that want to look like pros.
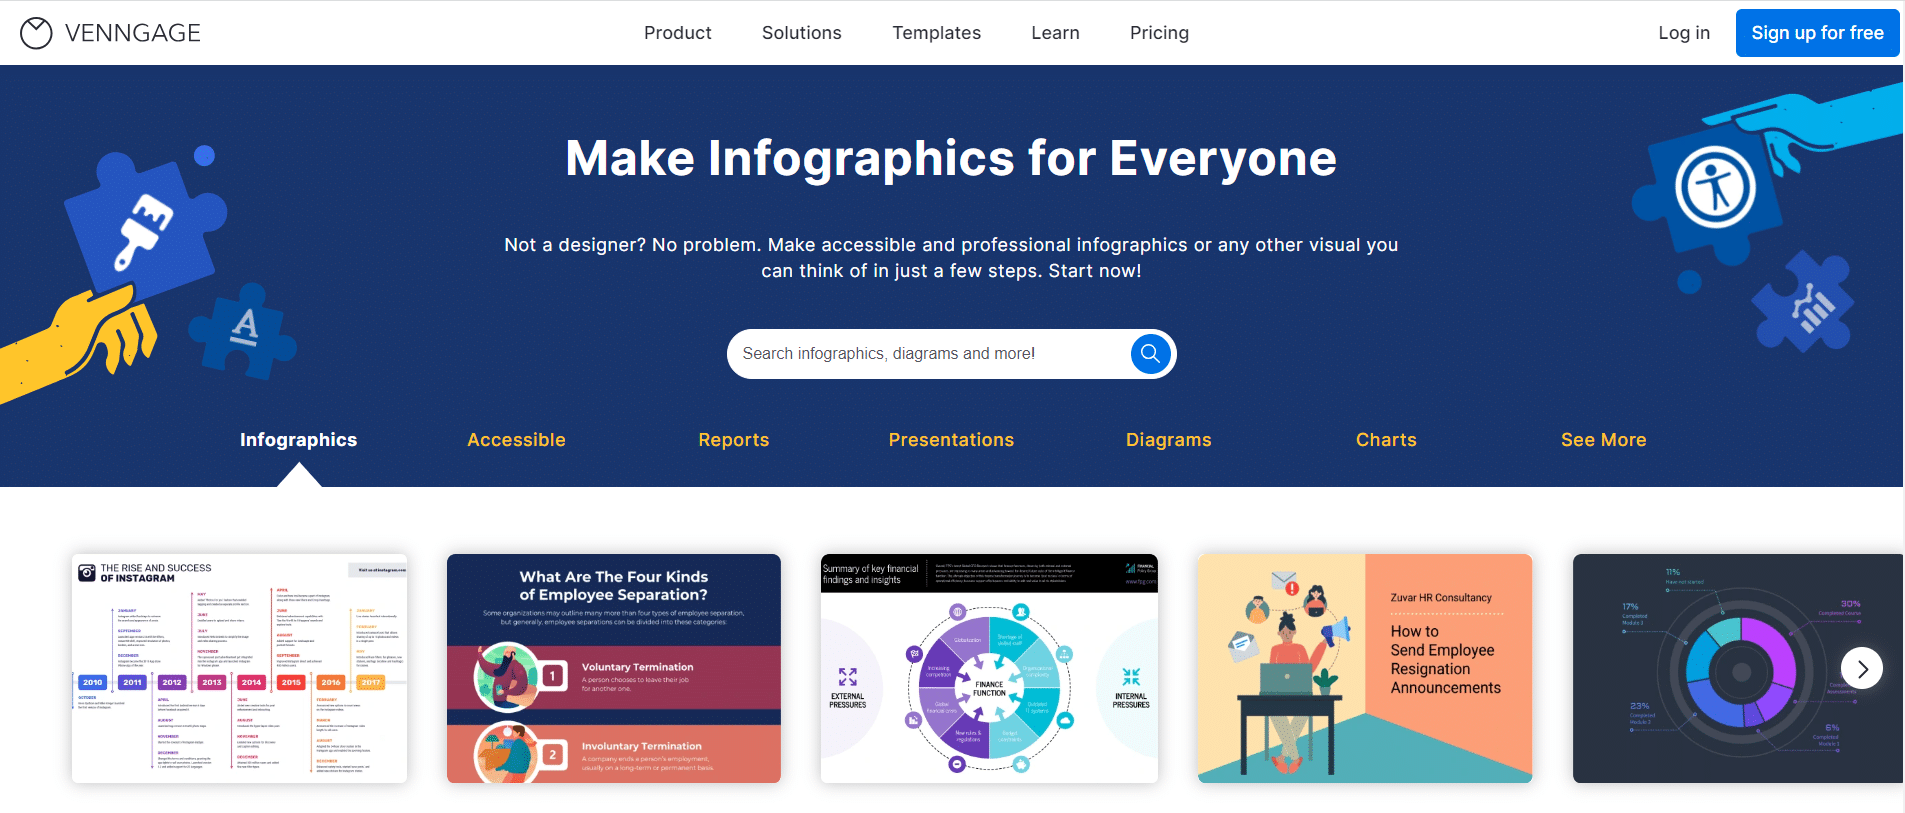
Ending the list is Venngage. Venngage is similar to both Canva and Piktochart – offering an array of infographic templates that you can go in and make your own. Again, premium templates require upgrading your account. But if this is your first foray into creating infographics or you just want to give creating an infographic a shot – it’s a great platform to try out.
Blue Ocean Interactive Marketing is here to make all your infographic dreams come true. Contact us today to learn more!